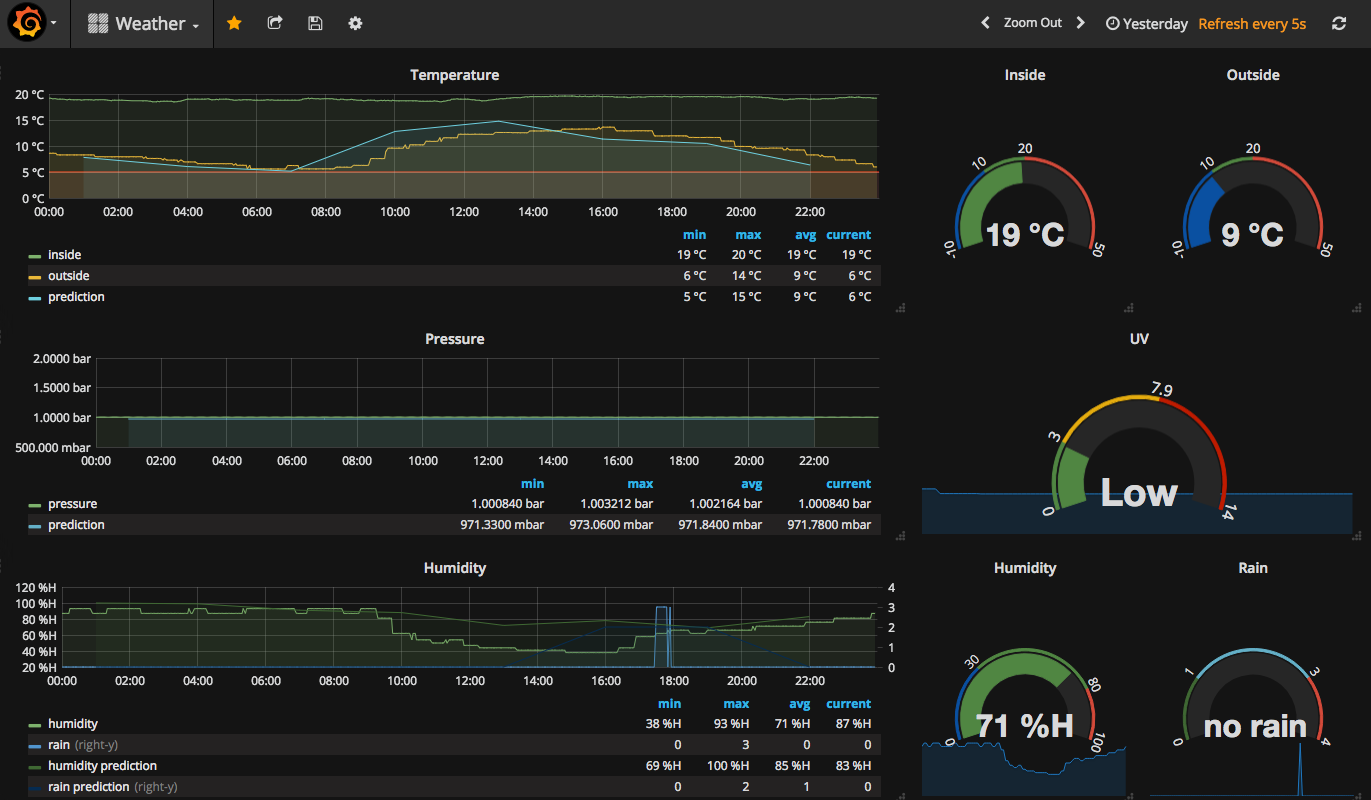
Today I want to play with Grafana. Let me show you my idea:
I’ve got a Beewi temperature sensor. I’ve been playing with it previously. Today I want to show the temperature within a Grafana dashboard. I want to play also with openweathermap API.
Fist I want to retrieve the temperature from Beewi device. I’ve got a node script that connects via Bluetooth to the device using noble library. I only need to pass the sensor mac address and I obtain a JSON with the current temperature
#!/usr/bin/env node
noble = require('noble');

var status = false;
var address = process.argv[2];

if (!address) {
    console.log('Usage "./reader.py <sensor mac address>"');
    process.exit();
}

function hexToInt(hex) {
    var num, maxVal;
    if (hex.length % 2 !== 0) {
        hex = "0" + hex;
    }
    num = parseInt(hex, 16);
    maxVal = Math.pow(2, hex.length / 2 * 8);
    if (num > maxVal / 2 - 1) {
        num = num - maxVal;
    }

    return num;
}

noble.on('stateChange', function(state) {
    status = (state === 'poweredOn');
});

noble.on('discover', function(peripheral) {
    if (peripheral.address == address) {
        var data = peripheral.advertisement.manufacturerData.toString('hex');
        out = {
            temperature: parseFloat(hexToInt(data.substr(10, 2)+data.substr(8, 2))/10).toFixed(1)
        };
        console.log(JSON.stringify(out))
        noble.stopScanning();
        process.exit();
    }
});

noble.on('scanStop', function() {
    noble.stopScanning();
});

setTimeout(function() {
    noble.stopScanning();
    noble.startScanning();
}, 2000);


setTimeout(function() {
    noble.stopScanning();
    process.exit()
}, 20000);
And finally another script (this time a Python script) to collect data from openweathermap API, collect data from node script and storing the information in a influxdb database.
from sense_hat import SenseHat
from influxdb import InfluxDBClient
import datetime
import logging
import requests
import json
from subprocess import check_output
import os
import sys
from dotenv import load_dotenv

logging.basicConfig(level=logging.INFO)

current_dir = os.path.dirname(os.path.abspath(__file__))
load_dotenv(dotenv_path="{}/.env".format(current_dir))

sensor_mac_address = os.getenv("BEEWI_SENSOR")
openweathermap_api_key = os.getenv("OPENWEATHERMAP_API_KEY")
influxdb_host = os.getenv("INFLUXDB_HOST")
influxdb_port = os.getenv("INFLUXDB_PORT")
influxdb_database = os.getenv("INFLUXDB_DATABASE")

reader = '{}/reader.js'.format(current_dir)


def get_rain_level_from_weather(weather):
    rain = False
    rain_level = 0
    if len(weather) > 0:
        for w in weather:
            if w['icon'] == '09d':
                rain = True
                rain_level = 1
            elif w['icon'] == '10d':
                rain = True
                rain_level = 2
            elif w['icon'] == '11d':
                rain = True
                rain_level = 3
            elif w['icon'] == '13d':
                rain = True
                rain_level = 4

    return rain, rain_level


def openweathermap():
    data = {}
    r = requests.get(
        "http://api.openweathermap.org/data/2.5/weather?id=3110044&appid={}&units=metric".format(
            openweathermap_api_key))

    if r.status_code == 200:
        current_data = r.json()
        data['weather'] = current_data['main']
        rain, rain_level = get_rain_level_from_weather(current_data['weather'])
        data['weather']['rain'] = rain
        data['weather']['rain_level'] = rain_level

    r2 = requests.get(
        "http://api.openweathermap.org/data/2.5/uvi?lat=43.32&lon=-1.93&appid={}".format(openweathermap_api_key))
    if r2.status_code == 200:
        data['uvi'] = r2.json()

    r3 = requests.get(
        "http://api.openweathermap.org/data/2.5/forecast?id=3110044&appid={}&units=metric".format(
            openweathermap_api_key))

    if r3.status_code == 200:
        forecast = r3.json()['list']
        data['forecast'] = []
        for f in forecast:
            rain, rain_level = get_rain_level_from_weather(f['weather'])
            data['forecast'].append({
                "dt": f['dt'],
                "fields": {
                    "temp": float(f['main']['temp']),
                    "humidity": float(f['main']['humidity']),
                    "rain": rain,
                    "rain_level": int(rain_level),
                    "pressure": float(float(f['main']['pressure']))
                }
            })

        return data


def persists(measurement, fields, location, time):
    logging.info("{} {} [{}] {}".format(time, measurement, location, fields))
    influx_client.write_points([{
        "measurement": measurement,
        "tags": {"location": location},
        "time": time,
        "fields": fields
    }])


def in_sensors():
    try:
        sense = SenseHat()
        pressure = sense.get_pressure()
        reader_output = check_output([reader, sensor_mac_address]).strip()
        sensor_info = json.loads(reader_output)
        temperature = sensor_info['temperature']

        persists(measurement='home_pressure', fields={"value": float(pressure)}, location="in", time=current_time)
        persists(measurement='home_temperature', fields={"value": float(temperature)}, location="in",
                 time=current_time)
    except Exception as err:
        logging.error(err)


def out_sensors():
    try:
        out_info = openweathermap()

        persists(measurement='home_pressure',
                 fields={"value": float(out_info['weather']['pressure'])},
                 location="out",
                 time=current_time)
        persists(measurement='home_humidity',
                 fields={"value": float(out_info['weather']['humidity'])},
                 location="out",
                 time=current_time)
        persists(measurement='home_temperature',
                 fields={"value": float(out_info['weather']['temp'])},
                 location="out",
                 time=current_time)
        persists(measurement='home_rain',
                 fields={"value": out_info['weather']['rain'], "level": out_info['weather']['rain_level']},
                 location="out",
                 time=current_time)
        persists(measurement='home_uvi',
                 fields={"value": float(out_info['uvi']['value'])},
                 location="out",
                 time=current_time)
        for f in out_info['forecast']:
            persists(measurement='home_weather_forecast',
                     fields=f['fields'],
                     location="out",
                     time=datetime.datetime.utcfromtimestamp(f['dt']).isoformat())

    except Exception as err:
        logging.error(err)


influx_client = InfluxDBClient(host=influxdb_host, port=influxdb_port, database=influxdb_database)
current_time = datetime.datetime.utcnow().isoformat()

in_sensors()
out_sensors()
I’m running this python script from a Raspberry Pi3 with a Sense Hat. Sense Hat has a atmospheric pressure sensor, so I will also retrieve the pressure from the Sense Hat.
From openweathermap I will obtain:
- Current temperature/humidity and atmospheric pressure in the street
- UV Index (the measure of the level of UV radiation)
- Weather conditions (if it’s raining or not)
- Weather forecast
I run this script with the Rasberry Pi crontab each 5 minutes. That means that I’ve got a fancy time series ready to be shown with grafana.
Here we can see the dashboard

Source code available in my github account.

