

Time ago, when I was an ADSL user in my house I had a lot problems with my internet connection. I was a bit lazy to switch to a fiber connection. Finally I changed it, but meanwhile the my Internet company was solving one incident, I started to hack a little bit a simple and dirty script that monitors my connection speed (just for fun and to practise with InfluxDB and Grafana).
Today I’ve lost my quick and dirty script (please Gonzalo keep a working backup the SD card of your Raspberry Pi Server always updated! Sometimes it crashes. It’s simple: “dd if=/dev/disk3 of=pi3.img” :) and I want to rebuild it. This time I want to use Docker (just for fun). Let’s start.
To monitor the bandwidth we only need to use the speedtest-cli api. We can use this api from command line and, as it’s a python library, we can create one python script that uses it.
import datetime
import logging
import os
import speedtest
import time
from dotenv import load_dotenv
from influxdb import InfluxDBClient

logging.basicConfig(level=logging.INFO)

current_dir = os.path.dirname(os.path.abspath(__file__))
load_dotenv(dotenv_path="{}/.env".format(current_dir))

influxdb_host = os.getenv("INFLUXDB_HOST")
influxdb_port = os.getenv("INFLUXDB_PORT")
influxdb_database = os.getenv("INFLUXDB_DATABASE")

def persists(measurement, fields, time):
    logging.info("{} {} {}".format(time, measurement, fields))

    influx_client.write_points([{
        "measurement": measurement,
        "time": time,
        "fields": fields
    }])

influx_client = InfluxDBClient(host=influxdb_host, port=influxdb_port, database=influxdb_database)

def get_speed():
    logging.info("Calculating speed ...")
    s = speedtest.Speedtest()
    s.get_best_server()
    s.download()
    s.upload()

    return s.results.dict()

def loop(sleep):
    current_time = datetime.datetime.utcnow().isoformat()
    speed = get_speed()

    persists(measurement='download', fields={"value": speed['download']}, time=current_time)
    persists(measurement='upload', fields={"value": speed['upload']}, time=current_time)
    persists(measurement='ping', fields={"value": speed['ping']}, time=current_time)

    time.sleep(sleep)

while True:
    loop(sleep=60 * 60) # each hour
Now we need to create the docker-compose file to orchestrate the infrastructure. The most complicate thing here is, maybe, to configure grafana within docker files instead of opening browser, create datasoruce and build dashboard by hand. After a couple of hours navigating into github repositories finally I created exactly what I needed for this post. Basically is a custom entry point for my grafana host that creates the datasource and dashboard (via Grafana’s API)
version: '3'

services:
  check:
    image: gonzalo123.check
    restart: always
    volumes:
    - ./src/beat:/code/src
    depends_on:
    - influxdb
    build:
      context: ./src
      dockerfile: .docker/Dockerfile-check
    networks:
    - app-network
    command: /bin/sh start.sh
  influxdb:
    image: influxdb:latest
    restart: always
    environment:
    - INFLUXDB_INIT_PWD="${INFLUXDB_PASS}"
    - PRE_CREATE_DB="${INFLUXDB_DB}"
    volumes:
    - influxdb-data:/data
    networks:
    - app-network
  grafana:
    image: grafana/grafana:latest
    restart: always
    ports:
    - "3000:3000"
    depends_on:
    - influxdb
    volumes:
    - grafana-db:/var/lib/grafana
    - grafana-log:/var/log/grafana
    - grafana-conf:/etc/grafana
    networks:
    - app-network

networks:
  app-network:
    driver: bridge

volumes:
  grafana-db:
    driver: local
  grafana-log:
    driver: local
  grafana-conf:
    driver: local
  influxdb-data:
    driver: local
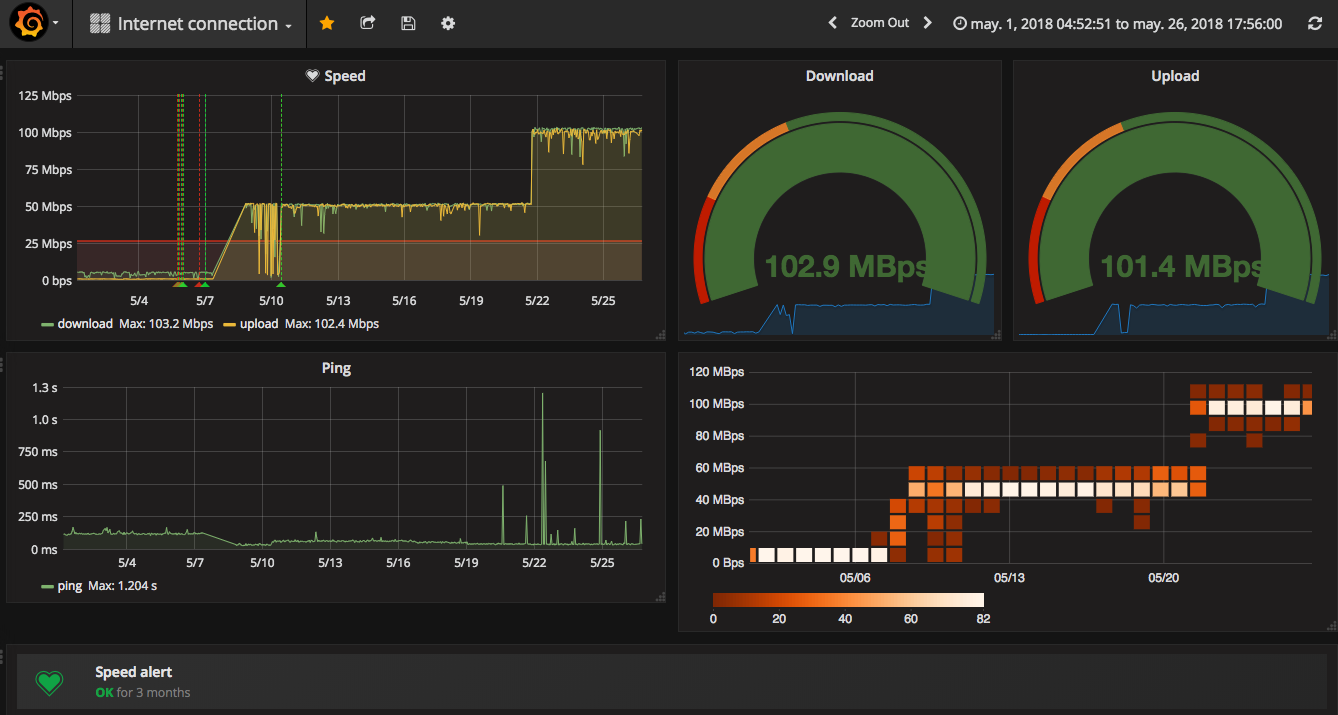
And that’s all. My Internet connection supervised again.
Project available in my github.